Today we’re launching a new project, Chicago Works For You, a citywide dashboard with ward-by-ward views of service delivery in Chicago.
 This site is going to be a central tool for Smart Chicago as we continue our work around internet access, digital skills, and civic apps. It allows us to engage residents, government, and developers around shared data so that we can all work together to make Chicago work better for all.
We’re conducting CUTGroup tests with residents, offering training and outreach to Alderman, and maintaining a full API of the data that drives our site.
This site is a result of years of work by many. It would not be possible without the vision of the MacArthur Foundation and the Chicago Community Trust to fund the Open311 project and the determination of the City of Chicago to make that implementation the largest and most comprehensive one in the world.
Much more to come. Write me at doneil@cct.og with questions or comments.
Meanwhile, here’s a look at what this site does, taken from the About page:
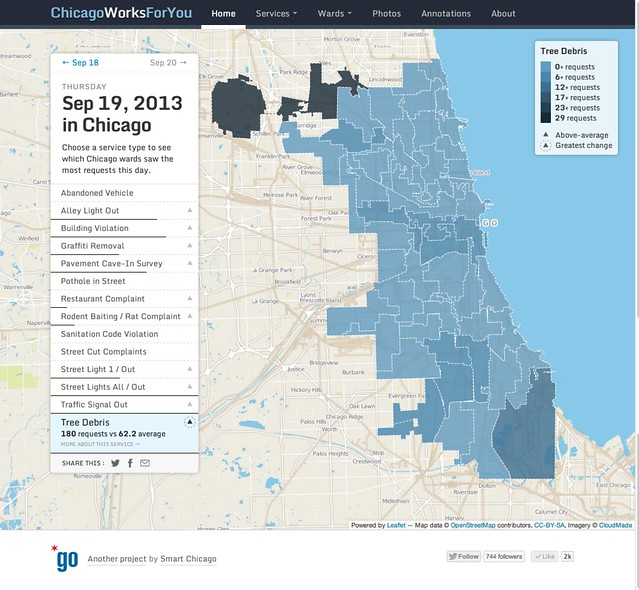
Home
The homepage is a citywide map with a daily summary of all service requests submitted, by service type and ward.
Dark lines under and up-arrows next to a request type means there were more requests of that type on that date than average. The longer the line, the higher above average. Highest above average is highlighted on the map as default.
Click any service request type to see the raw numbers and averages. The legend in the lake shows you the number ranges for each type in each ward. Click any service type to see those numbers for any day.
Go back and forth in time, it will show numbers for that service request, updating the web address so that you can share any view via Twitter, Facebook, or email.
For advanced users who like to hack URLs, you can type in any date you want, going back to January 1, 2008, the first day for which we have data from the City.
Services
Choose any service request type from the Services menu to see weekly views of service delivery by ward.
The bars show all requests opened in each ward, displayed by the day of the week it was opened. Hover over any bar to see exact numbers of opened requests. The check mark is how many requests of that type were closed in each ward.
Click any day to see that service type on a map.
Move backward and forward in time to see the weeks go by.
Each service has details on the work it takes to close requests. Again, you can share any view and click links to view raw data or submit requests of this type.
Wards
Choose any ward to see the week in review– all open and closed requests. You can choose any request or view all of them at the same time.
The Time-to-close ranking shows the average time from open to close, per request, in context with all other wards.
The Days with the most requests is a raw count for each service type for this ward, going back to January 1, 2008.
The alderman name links to their ward website, and the Chicago start links to their contact information on the City website. See also Facebook account, Twitter stream, and legislative history (as compiled by Councilmatic) links.
Photos
See the last 500 photos submits with service requests. You can sort by service request and see raw counts. Clicking any image takes you to the detail page on the City’s Service Tracker website to see details and current status.
Annotations
All of the data, maps, and charts on this site are just mute representations of a 14-type portion of the services delivered by the city for the city. We use our Tumblr blog to make observations and solicit yours.
 Earlier this month, Chicago Chief Technology Officer John Tolva unveiled the city’s very first technology plan. The plan was a result of a year-long process of research, brainstorming, and thinking about how to make all of Chicago competitive in the new digital economy.